
The rise of the machines: not just the lukewarm third installment of the Terminator series, but also, the ominous headline nearly every publication uses when writing about machine learning.
It can be a scary term for some – the notion that machine learning will supplant humans is on the horizon for some industries (one A.I. expert believes 40% of jobs could be replaced in 15 years). Machine learning is coming for finance too, a field where people are traditionally slow to adopt change (the progression from ticker tape to Excel to now has been exceedingly sluggish). However, contrary to popular belief, machine learning in finance is not some menacing black-box Skynet, rather it is an extension of human intelligence (specifically financial knowledge) with explainability, using concepts that are already in use today.
Relative valuation is a term many portfolio managers are familiar with. It uses ratios to help compare stocks that might otherwise be harder to compare against one another. Looking solely at, say, market cap, Apple (AAPL) at $1 trillion and BlackBerry (BB) at $4 billion seem like two very different companies. But applying ratios like price-to-earnings (P/E), by dividing stock price by earnings per share, allows an investment professional to look more clearly at each stock. Our machine learning performs a similar task: taking very different companies within a universe and comparing various features (individual to each model created) and making predictions on whether those companies will or will not beat the benchmark.
The machine’s predictions are all relative to the benchmark. Its predictions are saying that it believes Company A will beat the benchmark a bit more than Company B, which in turn will beat the benchmark slightly more than Company C, and so on.
Although some machine learning algorithms are of a black box nature (not like an airplane black box: it means that the user doesn’t know what is happening within the algorithm, they only receive a final product), ours offers explainability for why it made its predictions.
When making a model, a user selects the features they believe are important in their own process. Things like market cap (transformed using logarithms so all companies are comparable – another form of relative valuation), operating cash flow, sales to price ratio, even economic factors like T-bills, are all added to the user’s model to create a selection of stocks that will (ideally!) outperform the underlying benchmark. Usually, when the machine “likes” a stock (rates it 4-stars or higher), all of those features the user selected are green, meaning that it views them as positive drivers for the stock.
That is not always the case though. Sometimes, rarely, the combination of relative valuation and explainability offer curious results, like now in July 2020, when equities like Capital One Financial Corporation (COF) are rated highly (20th in overall 5-star picks), based on mostly negative features.
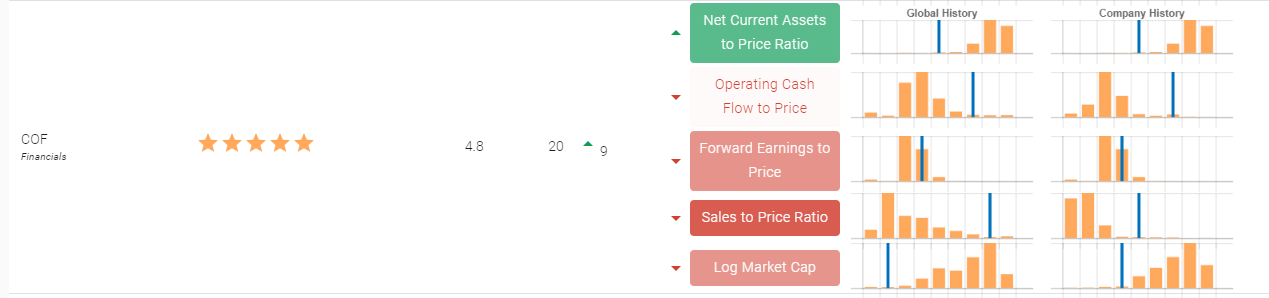
Remember that relative valuation means that the machine is simply making a prediction on how COF will do relative to the benchmark. In its universe – which we have chosen here as the S&P 500 – that means that the machine expects COF will beat (approximately) 480 other stocks relative to the benchmark.
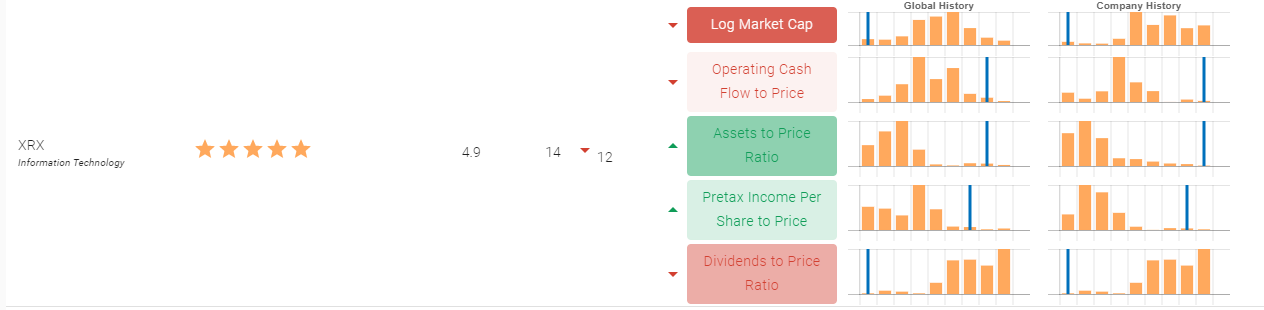
See all that red? The red indicates that the machine predicts that these features will be negative for the stock, even though it is ranked relatively highly. This is seen with many other top holdings of the machine, like Xerox (XRX), which is ranked 14 overall (which means the machine predicts it will beat 486 other stocks in the universe).
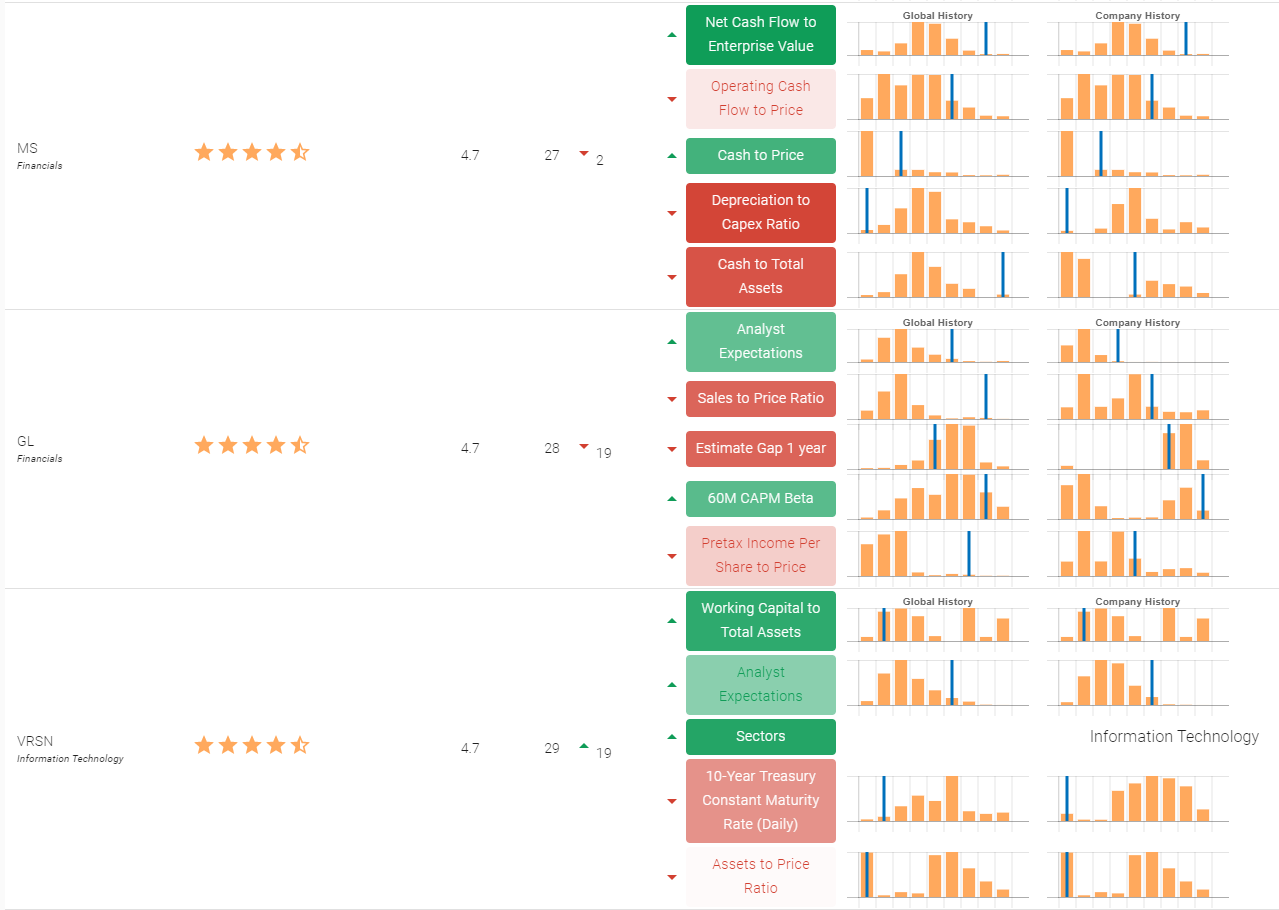
Indeed, looking here at the machine’s 27th, 28th and 29th rankings (which are Morgan Stanley, Globe Life and VeriSign, respectively), you can also see a whole lot of red. All that red means that the machine does not “like” these stocks, it just thinks that these stocks will do better than other stocks that it “likes” even less.
These screens come from a highly performant model we created based on the S&P 500. Its cumulative returns are 20.20% for its top picks (those it ranks 4-stars and higher, as seen above) and 0.32% for its bottom picks (those it ranks 0-1 stars). That means that the stocks the machine “likes” generally perform well, and those that it doesn’t, generally perform poorly.
Interestingly, the only other time the machine had its top picks look similar was in August 2008, right before the September market crash. For the second and third picks of the machine (here XTO Energy (XTO) and Monster Worldwide (MWW)) to have this many red (negative) features is very rare.
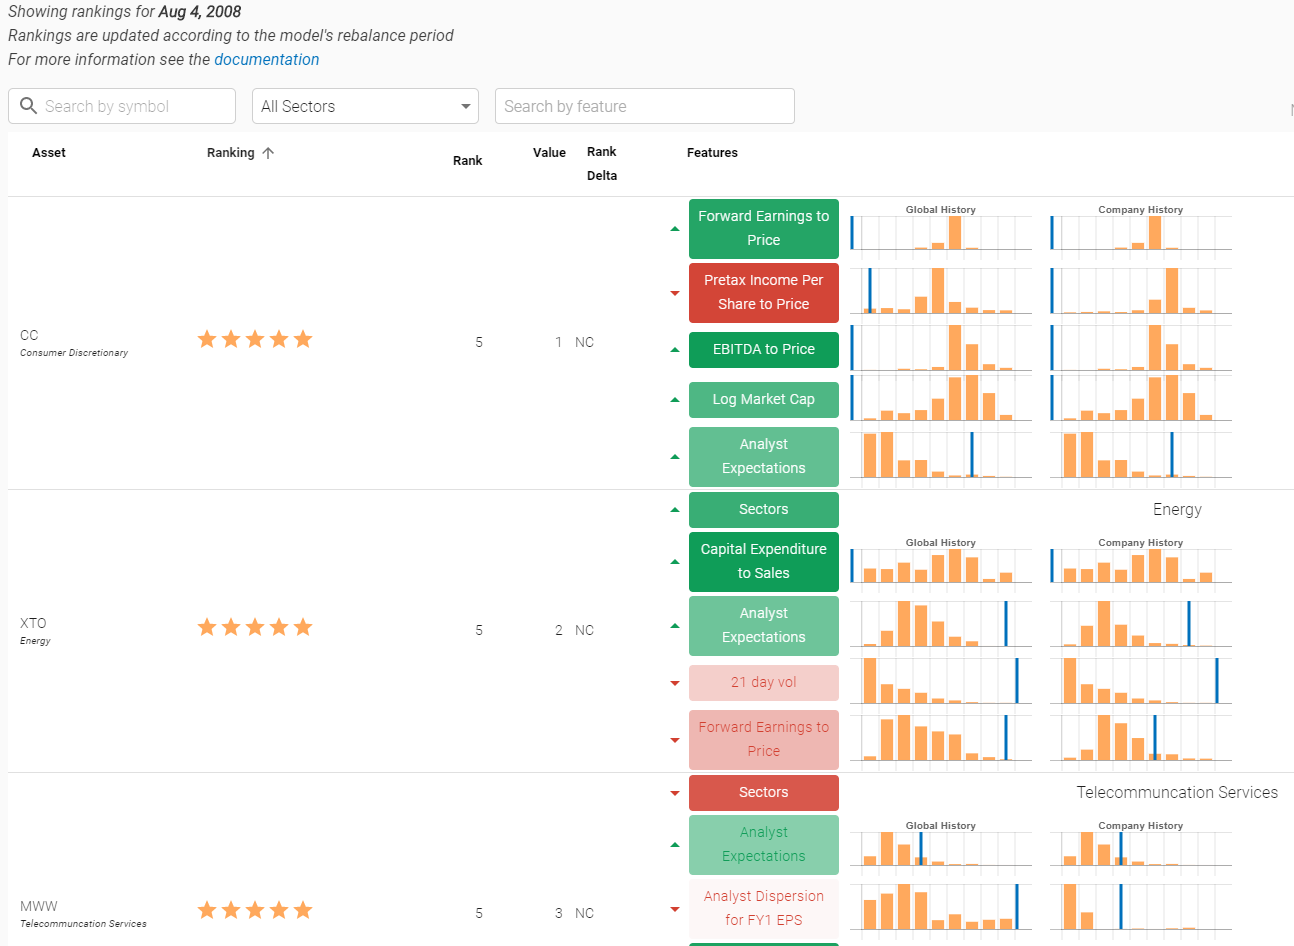
We cannot say if this will be a repeat of the past – there are different factors at play today versus in 2008. But it is interesting to note the similarities.
You can read our series on COVID-19 here.